
 Tamayakin’ initiative
ISOTHERMAL TRANSFORMATION CURVE TTT CURVE


 Return to list
Overview.
Isothermal transformation is a transformation that occurs when a material is cooled from austenite to 300~500°C while maintaining the austenite state and then held at the same isothermal temperature.
01 Isothermal transformation curve TTT curve
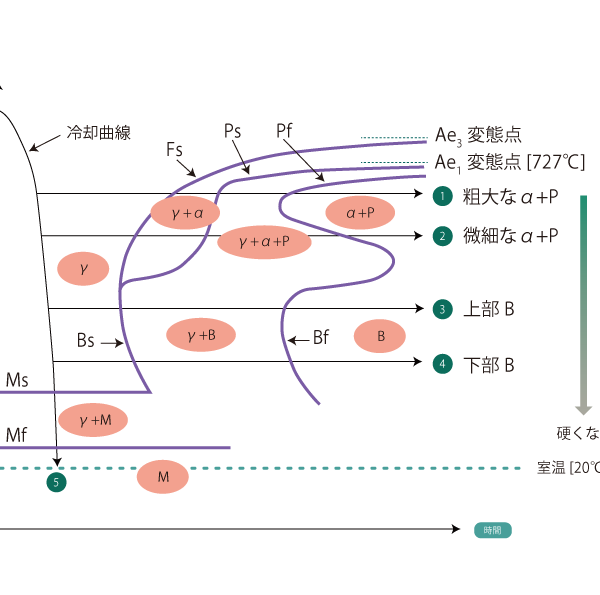
Isothermal transformation curve shows the microstructural changes that occur when a material is quenched from the austenite region to various temperatures and maintained at those temperatures. This curve is called TTT (T:Time, T:Temperature, T:Transformation) curve and, like the CCT curve, the vertical axis represents temperature and the horizontal axis represents time.
The part of the body that sticks out from long time to short time. nose is called 500°C to 550°C The more the nose is on the right side, the easier it is to heat treat using this curve. The more the nose is on the right side, the easier it is to heat treat using this curve.
The higher the amount of Mn, Cr, Mo, etc., which improves hardenability, and the higher the austenitizing temperature, the more the overall transition to the right side. Therefore, when presenting a specific TTT curve, the chemical composition and austenitization temperature must be indicated The TTT curve is shown in the following table.
02 Metallographic structure in TTT curve
When held isothermally at a higher temperature than the nose (isothermal holding lines ① and ②) the metallurgical microstructure of the alloy begins to transform from austenite (γ) to ferrite (α) at the transformation initiation line Fs, followed by pearlite transformation at the Ps point, and after the transformation at Pf is completed, the metallurgical microstructure of the alloy is ferrite (α) + pearlite (P) After the transformation of Pf is completed, ferrite (α) + pearlite (P). However, the lower the temperature at which the material is held isothermally, the harder it is.
When held isothermally at a lower temperature than the nose (isothermal holding lines (3) and (4)) The metallographic structure of Bf begins to transform to bainite (B) at the transformation initiation line Bs, and the metallographic structure after the completion of transformation of Bf is Bainite (B) after the transformation of Bf is completed. The hardness of this bainite also decreases as the temperature approaches 500°C, and becomes harder as the temperature approaches the Ms point. The bainite that occurs at high temperatures is Upper bainite and bainite produced at low temperatures is lower bainite is called "lower bainite.
The microscopic microstructure of the upper bainite is shown in the figure below.
Incidentally, bainite is a mixed structure of alpha iron and Fe3C, so it is basically the same as pearlite.