
 Tamayakin’ initiative
CONTINUOUS COOLING TRANSFORMATION CURVE CCT CURVE


 Return to list
Overview.
As steel cools gradually from austenite, the metallurgical microstructure at normal temperatures varies with the cooling rate. The microstructure will also differ from that of the equilibrium state.
01 Continuous cooling transformation curve CCT curve
As steel is gradually cooled from the austenite state, it transforms at a temperature completely different from the equilibrium state, depending on the cooling rate. This transformation diagram of cooling from the austenitic state is Continuous cooling transformation curve or CCT (Continuous, Cooling, Transformation) curve is called a
The CCT curve shows that the more alloys that increase hardenability, such as Cr and Mo, are included in the steel, the more the entire curve shifts to the right side, resulting in higher hardness even at slower cooling rates. Similarly, the entire curve shifts to the right even if the austenitization temperature is high.
02 Metallographic structure in CCT curves
| transformation curve
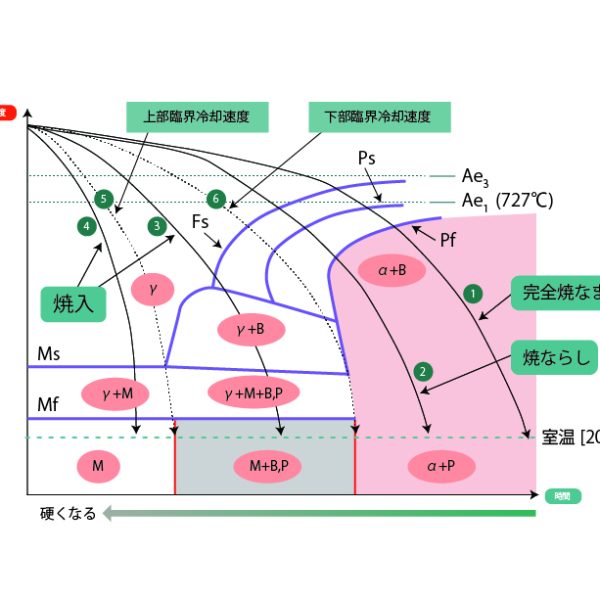
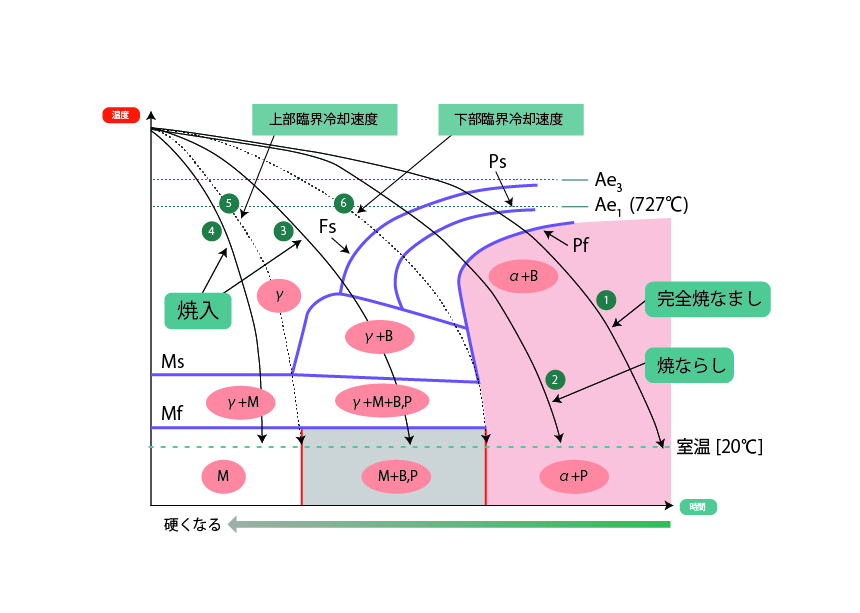
Fs: Transformation initiation line from austenite to ferrite Ps: Transformation initiation line from austenite to pearlite Pf: Transformation end line to pearlite Ms: Transformation initiation line from austenite to martensite MF: TRANSFORMATION END LINE TO MARTENSITE |
metallographic structure
γ: Austenite α: Ferrite P: PERLITE B: BAINITE M: MARTENSITE |
| Cooling curve
Solid line: (1) slowest cooling rate → (2) → (3) → (4) fastest cooling rate |
|
As shown above, the vertical axis is temperature and the horizontal axis is time. This figure shows the transformation diagram found mainly in steels for machine structural use, and it is based on the Bainitic transformation The figure is characterized by the fact that (1) is accompanied by bainitic transformation, and (2) is accompanied by bainitic transformation. The figure shows, in order of slowest cooling rate, (1) is complete annealing, (2) is annealing, and (3) and (4) are quenching. The transformation that passes in quenching (④) is only the Ms and Mf points, which transform from austenite to martensite, and the resulting metallurgical structure is a single phase of martensite. The transformation that passes through quenching in (3) is accompanied by bainitic transformation, and the resulting metallographic structure is a mixture of bainite and martensite.
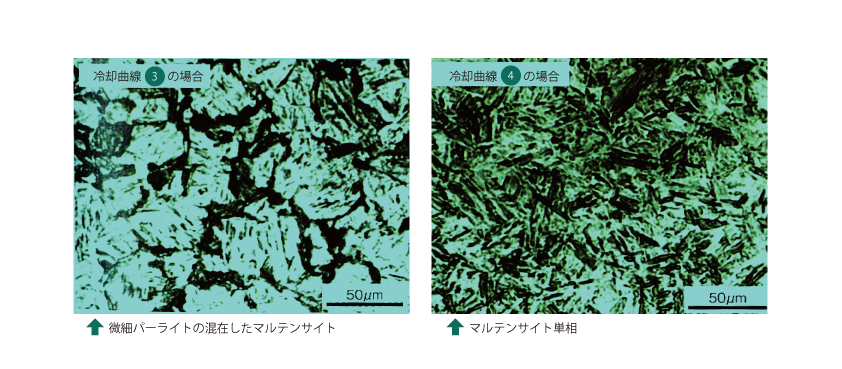
However, the above quenched microstructure is a metallurgical microstructure without bainitic transformation and mixed with fine pearlite.
The wavy lines (⑤ and ⑥) are the critical cooling rates with respect to quenching. Cooling curve ⑤ shows the slowest cooling rate to obtain martensitic single phase, which is Upper critical cooling rate This cooling rate is called the upper critical cooling rate. Curve ⑥ shows the cooling rate that no longer passes the Ms point, which is called Lower critical cooling rate This is called the lower critical cooling rate.